
Global Energy Trade Amid Post-Pandemic Recovery and Geopolitical Uncertainty
Econovis Team
The intersection of post-pandemic economic recovery and geopolitical uncertainty has intensified volatility in global energy markets, with profound consequences for economies heavily reliant on energy trade.
In 2022, global fuel trade reached a record $8 trillion, marking a 68% surge from 2019—more than twice the growth rate of total merchandise trade. As a result, fuels’ share of global merchandise trade rose from 12.3% in 2019 to 15.8% in 2022.
The sharp rise in energy prices has disproportionately benefited energy-exporting nations, driving revenue growth, while energy-importing countries have faced widening trade deficits and mounting economic costs. This study examines fuel trade dynamics by analyzing the top 20 economies with the largest trade surpluses and deficits in fossil fuels and related products. The analysis covers fuel trade patterns, trade balances, their impact on GDP, and the composition of fossil fuel trade in 2021 and 2022.
1. Fossil Fuel Trade: Winners & Losers
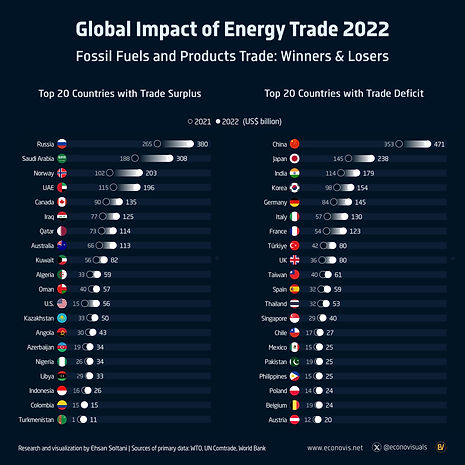
Energy trade exerts a significant influence on economies through trade surpluses or deficits, shaping their balance of payments. In 2022, Russia recorded the highest fossil fuel trade surplus at $380 billion, followed by Saudi Arabia ($308 billion), Norway ($203 billion), the United Arab Emirates ($196 billion), and Canada ($135 billion).
Conversely, China incurred the largest energy trade deficit at $471 billion, followed by Japan ($238 billion), India ($179 billion), South Korea ($154 billion), and Germany ($154 billion). The European Union, in particular, saw its energy trade deficit reach an unprecedented $671 billion in 2022, driven largely by soaring natural gas prices following sanctions on Russia.
2. The Role of Fossil Fuels in Global Trade
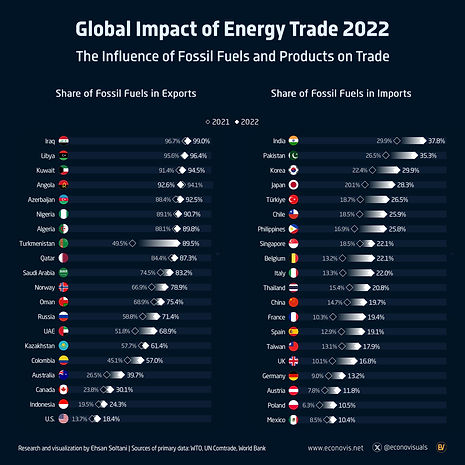
Fossil fuel exports are the primary revenue source for many energy-rich economies. In 2022, fossil fuels and related products accounted for 90% to 99% of total exports in Iraq, Libya, Kuwait, Angola, Azerbaijan, Nigeria, and Algeria. Similarly, their share ranged from 70% to 90% in Turkmenistan, Qatar, Saudi Arabia, Norway, Oman, Russia, the UAE, and Kazakhstan. In contrast, advanced energy-exporting nations had lower shares, with fossil fuels comprising 27% of Australia’s exports, 24% of Canada’s, and 14% of the United States'.
On the import side, dependence on fossil fuels varies based on domestic energy sources, including renewables, nuclear power, and coal. Some industrialized economies rely on fossil fuel imports to produce petrochemicals and energy-intensive goods for domestic use and export. In 2022, fossil fuels accounted for 35%–38% of total imports in India and Pakistan and 26% in Turkey, Chile, and the Philippines. The share was also significant in East Asian economies such as Japan (28%) and South Korea (30%). Meanwhile, European countries like Belgium, Italy, France, Spain, and the UK had import shares ranging from 17% to 22%, while Germany stood at 13%.
3. Economic Impact of Fossil Fuel Trade
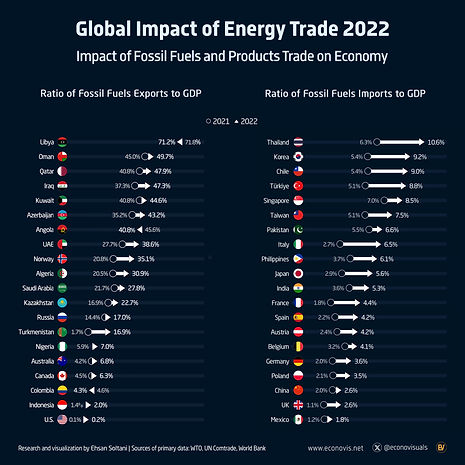
The ratio of energy trade to GDP reflects an economy’s dependence on fossil fuel imports (energy intensity) or exports (revenue reliance). A high energy import-to-GDP ratio indicates vulnerability to price fluctuations and supply shocks, while a high export-to-GDP ratio signifies reliance on energy revenues.
In 2022, fossil fuel exports accounted for 30%–70% of GDP in Libya, Oman, Qatar, Iraq, Kuwait, Azerbaijan, Angola, the UAE, Norway, and Algeria. For Russia and Saudi Arabia, these ratios stood at 17% and 23%, respectively. Despite their substantial fossil fuel exports, the U.S. (0.2%), Canada (6.3%), and Australia (6.8%) had significantly lower export-to-GDP ratios.
For major energy-importing countries, fossil fuel import-to-GDP ratios ranged from 5% to 11% in Thailand, South Korea, Chile, Turkey, Singapore, Taiwan, Pakistan, Italy, the Philippines, and Japan. In France, Spain, Austria, Belgium, Germany, and Poland, the ratio was between 3.5% and 4.4%. Notably, Japan’s and Italy’s fossil fuel import-to-GDP ratios surged from 2.8% in 2021 to approximately 6% in 2022, despite GDP growth rates of just 1% and 3.7%, respectively.
4. Composition of Oil, Gas, and Coal in Energy Trade
In 2022, fossil fuel imports were composed of 70% oil, 21% natural gas, and 9% coal, with crude oil accounting for 60% of total oil imports. Oil dominated fossil fuel exports in Angola, Canada, Colombia, Iraq, Kazakhstan, Kuwait, Libya, Nigeria, Oman, Saudi Arabia, and the UAE, comprising over 75% of their fossil fuel exports. The U.S. and Russia also had high oil export shares (60%–70%), while Norway, Qatar, and Turkmenistan were predominantly natural gas exporters. Australia, in contrast, exported both natural gas and coal.
On the import side, China, India, Malaysia, Mexico, Pakistan, the Philippines, South Korea, Thailand, and Turkey were primarily oil importers in 2022. European economies imported both oil and natural gas, while Japan and Taiwan relied on a mix of oil, natural gas, and coal.

Conclusion
Reducing energy intensity, expanding renewable energy sources, and enhancing energy efficiency are critical strategies for improving energy security and economic resilience. A diversified energy mix and reduced reliance on a single supplier enhance stability in energy trade. Additionally, maintaining a balanced energy trade ratio mitigates vulnerability to market fluctuations.
Energy trade extends beyond fossil fuels. Energy-intensive commodities such as basic metals, chemicals, and mineral resources contribute significantly to global energy trade through embedded energy consumption.
For developing economies like India, Vietnam, Turkey, the Philippines, and Bangladesh, high energy costs pose economic challenges, especially given their large energy trade deficits relative to GDP. Over 70% of the global population—representing 55% of world GDP—faces heightened exposure to rising energy prices. Addressing these challenges requires a strategic focus on sustainable energy policies and economic diversification.