Global Semiconductors: AI Boom Lifts Sales, but US Faces Rising Asia Competition
Econovis Team
The global semiconductor industry continues its rapid evolution, marked by surging sales, shifting regional market shares, and the transformative impact of artificial intelligence (AI) investments. In the twelve months ending June 2025, global semiconductor sales reached a record $686 billion—up 19.8% year-over-year—underscoring the sector's long-term expansion, with a compound annual growth rate (CAGR) of 8.0% since 1990.
Shifting Regional Market Shares: U.S. Rebounds, Asia Surges
In the early 1980s, the Americas—driven primarily by the United States—dominated the global semiconductor market, holding nearly 60% of total sales. However, this share steadily declined to about 20% by the 2010s, as Asia's influence grew rapidly. Asia overtook the Americas in 1985, and China became the world’s largest single-country market in the 2010s.

Europe’s share fell from over 30% in the early 1980s to 8.1% in 2024, while Japan—once commanding nearly 40% in the mid-1980s—declined to just 7.4% by 2024.
Despite long-term decline, the U.S. staged a recent comeback. The Americas’ share of global semiconductor sales rose from 22.0% in 2018 to 25.5% in 2023, then surged to 30.9% in 2024 amid a wave of AI-driven investment—surpassing China’s 28.9% share for the first time in over a decade.
Semiconductor Sales by Region in 2024:
• Americas (U.S.-led): $195 billion
• China: $182 billion
• Rest of Asia: $155 billion
• Japan: $47 billion
• Europe: $56 billion
.jpg)
U.S. Sales Slow After 2024 Peak
While 2024 marked a high point for U.S.-led semiconductor sales, the trend softened in 2025. Sales in the Americas dropped from a record $60.7 billion in Q4 2024 to $55.3 billion in Q1 2025 and $55.0 billion in Q2. Nevertheless, Q2 2025 sales were 24.1% higher than a year earlier, outpacing global growth (19.6%) and Asia (19.3%).
On a quarter-over-quarter basis, however, U.S. sales slipped by 0.6%, while global sales rose 7.8% and Asia surged 13.0%—signaling a renewed momentum shift toward Asia.
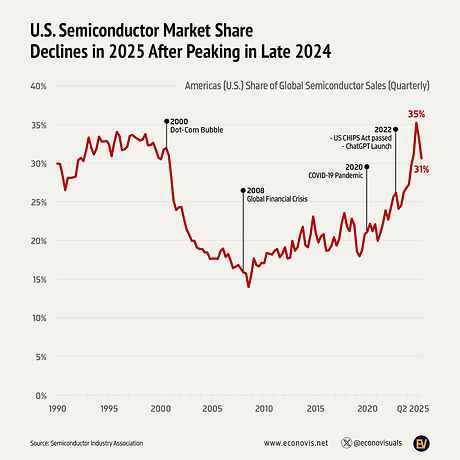
U.S. Market Share Slips Again in 2025
From Q2 2021 to Q4 2024, the Americas’ share of the global semiconductor market rose sharply from 20.9% to a peak of 35.2%, propelled by the AI boom. But in 2025, this upward trend reversed. Market share fell to 33.2% in Q1 and 30.6% in Q2, driven by weaker U.S. sales and renewed strength in Asia.
This short-term decline suggests that while the U.S. has regained some ground, the competitive pressures from Asia remain strong—especially as Asian manufacturers scale up capacity and attract global demand.

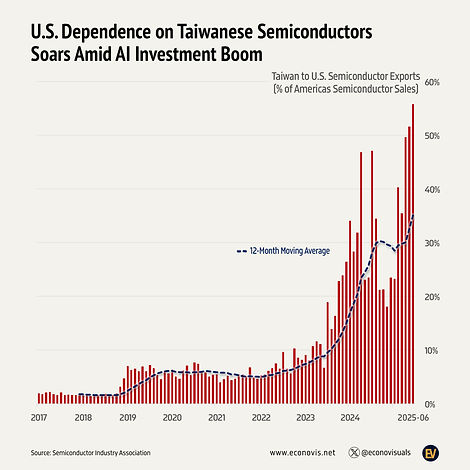
Surging U.S. Dependence on Taiwanese Chips
Taiwan’s role in the U.S. supply chain has deepened dramatically. Taiwanese semiconductor exports to the U.S.—including integrated circuits and data processing units—rose from just 2% of total Americas’ sales in 2018 to an average of 6% between 2019 and 2021. By the twelve months ending June 2025, that figure soared to 35%, reaching a record monthly high of 56% in June 2025 alone.
This surge reflects the U.S.’s growing reliance on Taiwan for advanced chips amid booming AI-related demand, raising both strategic value and potential geopolitical risk.
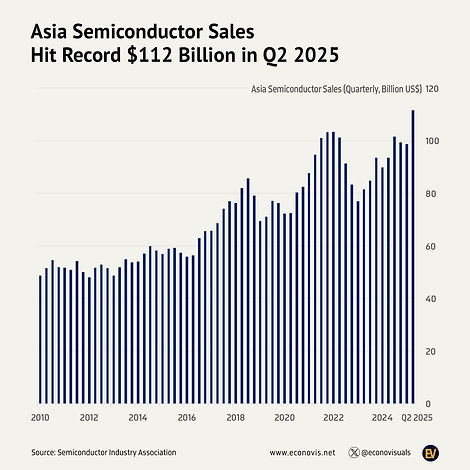
Asia Hits Record as China Slows and “Rest of Asia” Surges
Asia’s semiconductor sales reached a historic high of $112 billion in Q2 2025. While year-over-year growth stood at 19.3%, slightly below the Americas, the region led global growth in Q2 on a sequential basis with a 13.0% increase.
Performance within Asia varied:
• China’s sales rose 10.0% quarter-over-quarter.
• Japan saw a 2.9% decline.
• Rest of Asia (excluding China and Japan) posted a remarkable 29.4% increase—highlighting accelerating diversification and manufacturing expansion across the region.
Sources: Semiconductor Industry Association (U.S.) and Customs Administration of Taiwan