
The End of U.S. Dependence on OPEC Oil
Econovis Team
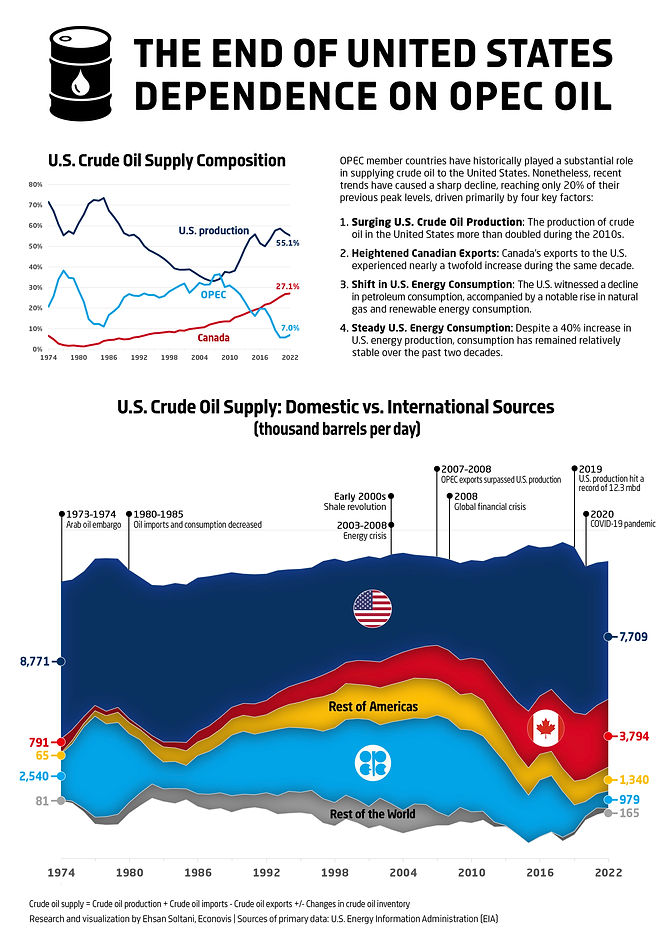
The Organization of the Petroleum Exporting Countries (OPEC) has historically played a major role in supplying crude oil to the United States. However, recent developments have led to a shift in this dynamic, primarily driven by four key factors:
(1) The United states experienced a remarkable surge in domestic crude oil production throughout the 2010s, more than doubling its output.
(2) Canada's exports of crude oil to the United States nearly doubled during the same period.
(3) Petroleum consumption in the United States has declined in recent years, while there was a notable upsurge in natural gas and renewable energies.
(4) Despite a 40% increase in U.S. energy production, consumption has remained relatively stable over the past two decades. Concurrently, energy density and per capita consumption decreased by approximately 30% and 10% respectively.
As a result of these factors, the United States' reliance on OPEC oil imports has declined significantly in recent years. OPEC's crude oil exports to the United States have plummeted to just one-fifth of their previous peak levels.
The rise of shale oil extraction technology has played a pivotal role in reshaping the U.S. oil production landscape over the past decade. Shale oil production surged from around half a million barrels per day (bpd) in 2008 to almost 8 million bpd in 2022, constituting two-thirds of the total U.S. crude oil output. This remarkable growth catapulted the U.S. to surpass both Russia and Saudi Arabia as the world's leading oil-producing country, with an average output of 11.0 million bpd in 2018.
This transformation has also been evident in trade dynamics. U.S. crude oil imports declined from over 10 million bpd in 2004-2007 to 6.3 million bpd in 2022. At the same time, U.S. crude oil exports increased from less than 50 thousand bpd in the 2000s to 3.6 million bpd in 2022. Consequently, the trade deficit of U.S. crude oil dropped from more than 10 million bpd during 2004-2007 to 2.7 million bpd in 2022. In a notable development, the trade balance of total crude oil and petroleum products has turned positive in both value and quantity since 2020, shifting from a deficit peak of 12.5 million bpd in 2005 to a surplus of 1.3 million bpd in 2022.
OPEC's exports to the U.S. market experienced fluctuations, with a peak of 5.6 million bpd in 1977, followed by a decline to 1.3 million bpd in 1985 due to reduced U.S. oil consumption. In 2007 and 2008, OPEC's crude oil exports to the United States surpassed domestic production levels, reaching a second peak of 5.4 million bpd. However, since then, OPEC's exports have steadily decreased, reaching 980 thousand bpd in 2022.
During the 1980s and 1990s, Mexico's crude oil exports to the United States exceeded those of Canada. However, since the 2000s, Canada's exports have surpassed Mexico's, making up over 70% of total Americas exports to the U.S. As of 2022, almost all of Canada's crude oil production is directed to the U.S. market.
Petroleum constituted 35.7% of the U.S. energy consumption in the year 2022. In parallel, natural gas and renewable energy sources accounted for 33.3% and 13.1% respectively. The sectors encompassing natural gas, biofuels, solar, and wind renewable energy have all reaped significant benefits from the ongoing transformative shift in the U.S. energy consumption landscape. These alternative energy sources have outpaced petroleum consumption since the year 2018.
While the trajectory of U.S. energy consumption has displayed modest growth, energy production has undergone a noteworthy expansion. Over the period spanning from 2008 to 2022, the total primary energy production within the United States witnessed a substantial increase of 40.6%. Notably, crude oil production experienced a remarkable surge of 132.4%, while natural gas and renewable energy production surged by 94.2% and 84.8%, respectively.
Conversely, the total primary energy consumption in the U.S. grew by a comparatively restrained 1.6% during the same timeframe. Noteworthy trends include a reduction in petroleum consumption by 2.5%, compared to an impressive 40.1% increase in natural gas consumption and an 82.0% increase in renewable energy consumption.
The winners in the United States crude oil market are the economies and energy industries of the U.S. and Canada, while the losers are OPEC members and, to a lesser extent, other oil exporters. From 2008 to 2022, U.S. crude oil producers increased their market share from 34.1% to 55.1%, and Canadian producers increased from 13.2% to 27.1%. During the same period, the share of OPEC members in the U.S. market decreased from 36.5% to 7.0%, and Latin America's share decreased from 12.7% to 9.6%. North America collectively supplied 86.8% of U.S. crude oil in 2022.
The era of U.S. energy dependence is approaching its end. A confluence of factors, including technological advancements, diversification of energy sources, the shale revolution, geopolitical dynamics, the global shift towards sustainable energy, environmental imperatives, and economic considerations, has systematically reshaped the paradigm of the U.S. energy sector and market. These influential constituents, which have exerted their sway over modern as well as traditional energy spheres, are positioned to reaffirm the standing of the United States within the worldwide energy market.
All figures and numbers are based on data from the U.S. Energy Information Administration (EIA).