top of page
Search


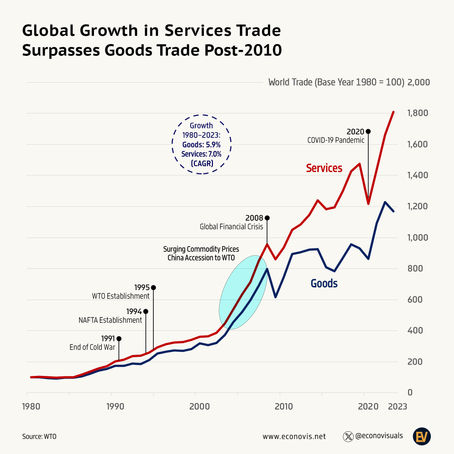
Global Growth in Services Trade Surpasses Goods Trade Post-2010
From 1980 to 2011, global services trade grew at an annual growth rate (CAGR) of 7.9%, slightly outpacing the 7.3% growth in goods trade....
Admin
Jan 4, 20251 min read


India's Trade Balance of Goods and Services (1990–2023)
Despite Service Sector Growth, India's Overall Trade Deficit Persists. In 2023, a Services Trade Surplus of $96 Billion Could Not Offset...
Admin
Jul 21, 20241 min read


U.S. Goods Trade Deficit by Main Categories (2000–2023)
In 2023, consumer goods were the main driver of the U.S. trade deficit, with a deficit of $501 billion, accounting for 47% of the total....
Admin
Jun 11, 20241 min read


U.S. Goods Trade Deficit Reached $1,060 Billion in 2023
U.S. goods trade deficit with an annual growth rate of 3.8% from $447 Billion in 2000 reached $1,060 Billion in 2023.
Admin
Jun 11, 20241 min read


U.S. Industrial Supplies Exports Surpassed Capital Goods Exports
Since 2021, U.S. exports of raw and primary products (industrial supplies and materials) have surpassed those of capital goods excluding...
Admin
Jun 11, 20241 min read


China Exports Shifted After Financial Crisis 2008
China experienced export boom with high annual growth of 27.2% from 2001 to 2008, followed by a transition to slower growth, averaging...
Admin
May 22, 20241 min read
bottom of page
