top of page
Search


U.S. Data Processing Unit Imports Jump to $14.8 Billion in June 2025 Amid AI Boom
U.S. imports of data processing units jumped to $14.8 billion in June 2025, pushing the 12-month total to $110 billion. This represents a...
Admin
Aug 21, 20251 min read


U.S. Trade Deficit by Region: Asia Leads, China’s Share Falls
In the 12 months ending Q2 2025, the U.S. goods trade deficit totaled $1,353 billion. Asia remained the largest contributor with $816...
Admin
Aug 21, 20251 min read


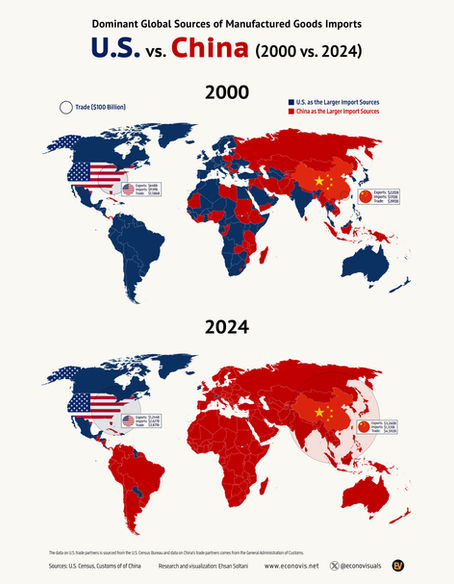
Dominant Global Sources of Manufactured Goods Imports: U.S. vs. China (2000 vs. 2024)
This dual-world map visualization illustrates the shift in global dominance between the United States and China as the primary sources of...
Admin
Jul 25, 20251 min read


U.S. Goods Trade Deficit Hits Record $1.2 Trillion in 2024
In 2024, the U.S. goods trade deficit reached a historic high of $1.20 trillion, surpassing the previous record of $1.18 trillion set in...
Admin
Feb 2, 20251 min read


China's Crude Oil Import Sources in 2024
China's crude oil imports have surged from 1.4 million barrels per day (bpd) in 2000 to an unprecedented 11.1 million bpd in 2024,...
Admin
Feb 2, 20251 min read


Russia Becomes China's Top Crude Oil Supplier in 2024 with 2.19 Mb/D, Surpassing Saudi Arabia's 1.55 Mb/D
Russia, Saudi Arabia, Malaysia, and Iraq supplied 57.5% of China’s crude oil imports in 2024. In 2024, Russia exported 2.19 million...
Admin
Jan 27, 20251 min read


China's Global Trade Surplus Soars, but U.S. Growth Lags
Since the onset of U.S.-China trade tensions in 2018, China's overall trade surplus surged by 176%, climbing from $359 billion to $992...
Admin
Jan 27, 20251 min read


U.S. and EU Drive 61% of China’s Trade Surplus in 2024 Despite Modest 24%
In 2024, China's trade surplus was heavily driven by the U.S. and EU, which accounted for 61.3% of the total surplus. Despite their...
Admin
Jan 21, 20251 min read


The Rise of South-South Trade: Expanding Economic Ties Between Emerging Market and Developing Economies
Trade among Emerging Market and Developing Economies (EMDEs) expanded eightfold (10% CAGR), from $1.7 trillion in 2001 to $14.0 trillion...
Admin
Jan 20, 20251 min read


U.S.-Canada Trade Supports U.S. Manufacturing and Jobs Despite Overall Deficit
Surpluses in Manufactured Goods and Services Trade with Canada vs. Deficits in Fuels and Crude Materials In the trailing twelve months...
Admin
Jan 18, 20251 min read


U.S. $873 Billion Goods and Services Trade Deficit in 2023 vs. EU $216 Billion Surplus and China's $652 Billion Surplus
· U.S. Trade Deficit: The U.S. goods and services trade deficit reached $873 Billion in 2023, reflecting a long-standing trend of...
Admin
Jan 18, 20252 min read


U.S. Share of World Imports Reaches 13.1% in 2023 vs. EU at 11.2% and China at 10.5%
The U.S. share of global goods imports reached 13.1% in 2023, exceeding the European Union at 11.2% and China at 10.5%. Between 2000 and...
Admin
Jan 18, 20251 min read


China's Trade Soars to $6.2 Trillion in 2024: $3.6 Trillion in Exports, $2.6 Trillion in Imports, and $1 Trillion Surplus
Between 2019 and 2024, China's exports surged by 43%, rising from $2.5 trillion to $3.6 trillion. Imports increased by 25%, growing from...
Admin
Jan 18, 20251 min read


China's Share of World Exports Reaches 14.2% in 2023 vs. EU at 11.6% and U.S. at 8.5%
China's share of global goods exports climbed to 14.2% in 2023, significantly surpassing the European Union at 11.6% and the United...
Admin
Jan 18, 20251 min read


Diverging Trade Dynamics: U.S. Deficit vs. China Surplus
In the 12 months ending November 2024, the U.S. trade deficit reached $1.17 trillion, while China recorded a $0.96 trillion trade...
Admin
Jan 14, 20251 min read


China's Share of World Trade Reaches 12.3% in 2023 vs. EU at 11.4% and U.S. at 10.8%
China's share of global goods trade rose to 12.3% in 2023, surpassing the European Union at 11.4% and the United States at 10.8%. From...
Admin
Jan 14, 20251 min read


Global Leaders in Manufactured Goods Exports
Global exports of manufactured goods reached $15.55 trillion in 2023, comprising 65% of total world exports. China was the largest...
Admin
Jan 13, 20251 min read


China's Trade Dependence on the U.S. Declines Sharply, Outpacing the U.S. Shift Away from China
The U.S. share of China’s trade (exports + imports) increased from 11% in 1985 to a peak of 26% in 1998 and 1999. Since 2000, this share...
Admin
Jan 9, 20251 min read


U.S. Trade Balance November 2024 (TTM): $879B Total Deficit, with $292B Services Surplus and $1,171B Goods Deficit
The U.S. recorded a total trade deficit of $879 billion in the 12 months ending November 2024 (TTM). This figure comprises a $292 billion...
Admin
Jan 8, 20251 min read


U.S. $57 Billion Fuels Trade Surplus in 2023 vs. EU $455 Billion Deficit and China's $435 Deficit
The following key trends are highlighted: United States: Historically had a fuels trade deficit, which began improving significantly...
Admin
Jan 4, 20251 min read
bottom of page
