top of page
Search


U.S. Goods Trade Deficit Reached $1,074 Billion (TTM) in March 2024
The U.S. goods trade deficit soared by 43% from February 2020 to October 2022, but decreased by 11% from October 2022 to March 2024,...
Admin
Jun 12, 20241 min read


Trade Dependence of Agriculture and Food Products: Top Countries with Agriculture and Food Trade Surplus and Deficit
Global trade in agriculture and food products experienced a significant surge in 2022, reaching an impressive $4,758 billion. This marked...
Admin
Jun 12, 20243 min read


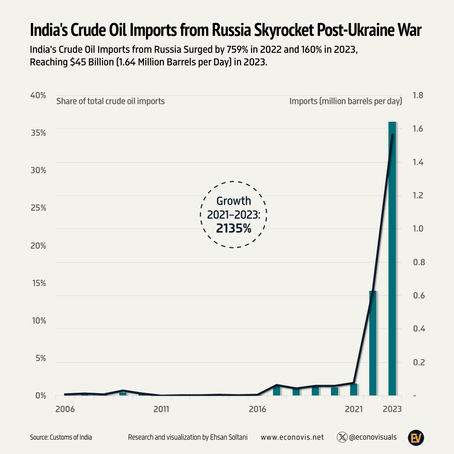
India's Crude Oil Imports from Russia Skyrocket Post-Ukraine War
India's Crude Oil Imports from Russia Surged by 759% in 2022 and 160% in 2023, Reaching $45 Billion (1.64 Million Barrels per Day) in 2023.
Admin
Jun 12, 20241 min read


Globalization Stalled Since 2007
Trade Openness Growth Halted After the Global Financial Crisis; Trade of Goods and Services as a Share of GDP Fluctuated Around 59%.
Admin
Jun 12, 20241 min read


Rise and Fall of Russian Oil in EU Market
Crude oil imports of the European Union from Russia decreased from 3.6 million barrels per day (mmb/d) in 2010 to 2.3 mmb/d in 2021, and...
Admin
Jun 12, 20241 min read


U.S. Goods Exports, Imports, and Trade Deficit
With exports of $2,053 billion and imports of $3,112 billion, U.S. goods trade deficit reached $1,060 Billion in 2023.
Admin
Jun 12, 20241 min read


China's Exports to ASEAN Surpass U.S. and EU
China's exports to ASEAN reached $526 billion in 2023, surpassing those to both the United States and the European Union by $502 billion...
Admin
Jun 11, 20241 min read


U.S. Goods Trade Deficit by Main Categories (2000–2023)
In 2023, consumer goods were the main driver of the U.S. trade deficit, with a deficit of $501 billion, accounting for 47% of the total....
Admin
Jun 11, 20241 min read


China Trade with Russia More than Doubled in Last Three Years
China's trade with Russia surged before the Ukraine conflict. From January 2021 to April 2024, overall trade increased by 127%, with...
Admin
May 22, 20241 min read


China Exports Shifted After Financial Crisis 2008
China experienced export boom with high annual growth of 27.2% from 2001 to 2008, followed by a transition to slower growth, averaging...
Admin
May 22, 20241 min read


Global Commodity Returns Q1 2024
The global commodity market exhibited overall price stability in the year leading up to March 2024, although the first quarter of 2024...
Admin
Apr 6, 20241 min read


Commodity Bull and Bear Markets (2000–2024/03)
The commodity total price index climbed by 3.5% in the first quarter 2024 compared to December 2023, levels observed in March 2023.
Admin
Apr 6, 20241 min read


Global Commodity Returns 2023
The global commodity market has witnessed price declines following the mitigation of post-pandemic and Ukraine war shocks. According to...
Admin
Mar 17, 20241 min read


Commodity Bull and Bear Markets
All Commodity Price Index (2010 = 100] and Annual Growth Rate (2000-2023 From the beginning of the 21st century to 2023, commodity...
Admin
Feb 16, 20241 min read


Asia Conquers U.S. Apparel Market, but China Lags Behind
United States apparel imports surged by 81%, increasing from USD 64 billion in 2000 to USD 116 billion in 2022, while total goods imports...
Admin
Feb 16, 20242 min read


U.S. Crude Oil Imports from Canada, Mexico and Saudi Arabia (1973–2022)
#USA #energy #OOTT #oil #crudeoil #petroleum #ShaleOil #FossilFuels #fuels #exports #imports #trade
Admin
Sep 17, 20231 min read


U.S. Dependence on OPEC and Non-OPEC Crude Oil
#USA #energy #OOTT #oil #crudeoil #petroleum #ShaleOil #FossilFuels #fuels #exports #imports #trade
Admin
Sep 17, 20231 min read


U.S. Crude Oil Imports from OPEC and Non-OPEC Suppliers
#USA #energy #OOTT #oil #crudeoil #petroleum #ShaleOil #FossilFuels #fuels #exports #imports #trade
Admin
Sep 17, 20231 min read


U.S. Share of World Crude Oil Exports and Imports
#USA #energy #OOTT #oil #crudeoil #ShaleOil #FossilFuels #fuels #exports #imports #trade
Admin
Sep 17, 20231 min read


U.S. Share of World Crude Oil Trade oscillated Around 11% from the 1990s to 2022
#USA #energy #OOTT #oil #crudeoil #ShaleOil #FossilFuels #fuels #exports #imports #trade
Admin
Sep 17, 20231 min read
bottom of page
