top of page
Search


U.S. Exports of Dollar Banknotes (1970–2025)
U.S. dollar held abroad 2025 reached $1.05T, nearly half of all U.S. currency in circulation. After decades of rapid growth—peaking during the 2020 pandemic—foreign demand has now plateaued, reflecting shifts toward digital payments and cryptocurrencies.
Admin
Aug 21, 20251 min read


U.S. Data Processing Unit Imports Jump to $14.8 Billion in June 2025 Amid AI Boom
U.S. imports of data processing units jumped to $14.8 billion in June 2025, pushing the 12-month total to $110 billion. This represents a...
Admin
Aug 21, 20251 min read


Social Benefits Now Account for Nearly Half of U.S. Government Spending
In Q2 2025, social benefits comprised 46.2% of U.S. government current expenditures, up from 18.8% in 1960, 30.7% in 1980, and 34.9% in...
Admin
Aug 21, 20251 min read


U.S. Trade Deficit by Region: Asia Leads, China’s Share Falls
In the 12 months ending Q2 2025, the U.S. goods trade deficit totaled $1,353 billion. Asia remained the largest contributor with $816...
Admin
Aug 21, 20251 min read


Global Semiconductor Industry Sales (1980–Q2 2025)
💾 Global chip sales hit a record $686B in the 12 months to June 2025, up +19.8% YoY and growing at a long-term 8% CAGR since 1990....
Admin
Aug 21, 20251 min read


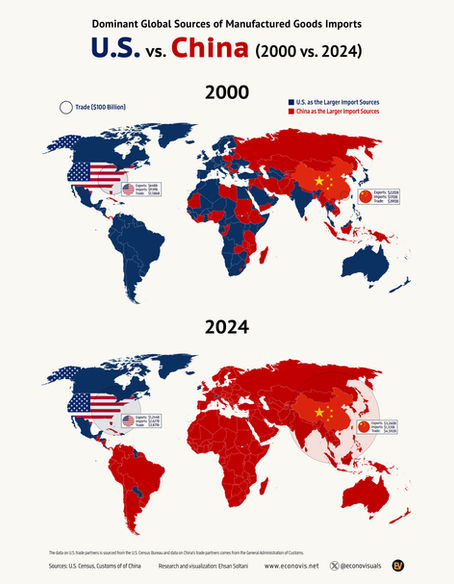
Dominant Global Sources of Manufactured Goods Imports: U.S. vs. China (2000 vs. 2024)
This dual-world map visualization illustrates the shift in global dominance between the United States and China as the primary sources of...
Admin
Jul 25, 20251 min read


U.S.-EU Export Interdependence: Diverging Trends Since the Global Financial Crisis
The EU’s reliance on exports to the U.S. increased from 1.9% of GDP in 2008 to 3.0% in 2024, while the U.S. reliance on exports to the EU...
Admin
Feb 4, 20251 min read


U.S.-EU Trade Interdependence: Diverging Trends Since the Global Financial Crisis
Since the Global Financial Crisis, trade between the U.S. and the European Union has followed divergent trends relative to each economy's...
Admin
Feb 4, 20251 min read


Top Crude Oil Suppliers to the U.S. (1975–2024): Canada's Dominance Over OPEC
In the 12 months ending November 2024, U.S. crude oil imports averaged 6.58 million barrels per day (Mb/D)—35% lower than the peak levels...
Admin
Feb 4, 20251 min read


EU-U.S. Trade (LTM Nov 2024): €529 Billion Exports, €336 Billion Imports, €193 Billion Surplus
In the 12 months ending November 2024, European Union trade with the U.S. totaled €866 billion, comprising €529 billion in exports, €336...
Admin
Feb 4, 20251 min read


Canada Supplied 61% of U.S. Crude Oil Imports in 2024, Reaching a Record 4.0 Mb/D
In the 12 months ending November 2024, U.S. crude oil imports from Canada reached a record 4.0 million barrels per day (Mb/D), accounting...
Admin
Feb 2, 20251 min read


U.S. Crude Oil Trade Balance (Nov 2024, LTM): 4.17 Mb/D Exports, 6.58 Mb/D Imports, 2.40 Mb/D Deficit
In the 12 months ending November 2024, U.S. crude oil exports averaged 4.17 million barrels per day (Mb/D), while imports reached 6.58...
Admin
Feb 2, 20251 min read


U.S. Trade-to-GDP Ratio Declines Steadily Since 2012
The U.S. trade-to-GDP ratio peaked at 24.0% in 2011 but has steadily declined, reaching 18.4% in 2024.
Admin
Feb 2, 20251 min read


Diverging Trade Balances: U.S. Deficit Hits $1.2 Trillion as China’s Surplus Climbs to $1.0 Trillion
In 2024, the U.S. trade deficit widened to $1.2 trillion, marking a 13.3% increase from the previous year, while China’s trade surplus...
Admin
Feb 2, 20251 min read


U.S. Goods Trade Deficit Hits Record $1.2 Trillion in 2024
In 2024, the U.S. goods trade deficit reached a historic high of $1.20 trillion, surpassing the previous record of $1.18 trillion set in...
Admin
Feb 2, 20251 min read


U.S. AI Boom Fuels Surging Demand for Taiwan’s Chips
U.S. Imports of Data Processing Units and Integrated Circuits from Taiwan Reach $55.1 Billion in 2024 The rapid expansion of artificial...
Admin
Feb 2, 20251 min read


U.S. Trade Deficit: Shift from China to the Rest of the World
The U.S.-China trade war has had a lasting impact on the U.S. trade deficit, redirecting a significant portion of it from China to other...
Admin
Feb 2, 20251 min read


U.S. Broad Money Supply Stagnates While China Expands (2021–2024)
From December 2021 to December 2024, the U.S. M2 money supply experienced near-zero growth, while China’s M2 expanded by 15.1%. Over the...
Admin
Feb 2, 20251 min read


U.S. M2 Money Supply Growth Rebounds
Following 19 consecutive months of contraction, U.S. M2 money supply growth turned positive in November 2023. By December 2024, it had...
Admin
Feb 2, 20251 min read


U.S. M2 Money Supply Reaches $21.63 Trillion in December 2024
The U.S. M2 money supply increased by 3.9% year-over-year and 0.87% month-over-month in December 2024, reflecting continued monetary...
Admin
Feb 2, 20251 min read
bottom of page
